
Chrome has introduced CrUX Vis, an innovative tool designed to help users visualize Core Web Vitals trends, aiding in performance optimization and debugging.
What is CrUX Vis?
CrUX Vis is a new performance analysis tool by Google that uncovers hidden patterns in Core Web Vitals scores, providing actionable insights for improvement. It utilizes data from the Chrome User Experience Report (CrUX), which is based on real user experiences from analyzed URLs and websites.
Understanding CrUX Data
CrUX, or the Chrome User Experience Report, reflects how real-world Chrome users interact with various websites. This dataset is the foundation for Core Web Vitals metrics, which aim to measure user-centric aspects of web performance.
According to Chrome’s documentation, CrUX gathers data from real browsers worldwide, focusing on certain browser settings to determine user eligibility. The collected metrics allow site owners to understand how visitors experience their websites. This data is used in tools like Google Search, influencing the page experience ranking factor.
However, not all websites or web pages are included in the CrUX dataset. To be represented, a site must meet specific criteria, including being publicly accessible and having sufficient traffic to create statistically significant data.
Why Core Web Vitals Matter
While improving Core Web Vitals scores might not directly boost search rankings, optimizing website performance remains essential. High-performance scores contribute to better user experience, increased engagement, higher ad clicks, conversions, and overall site success. Sites that don’t focus on performance may miss out on their full potential.
Previous tools like Chrome’s Lighthouse offered performance snapshots, but they lacked the ability to track performance over time or provide detailed insights into trends. This is where CrUX Vis comes in.
How CrUX Vis Works
CrUX Vis, short for Chrome User Experience Visualization, is a data visualization tool that allows users to explore CrUX data in a new way. It provides a comprehensive view of performance at both the URL and site (origin) level.
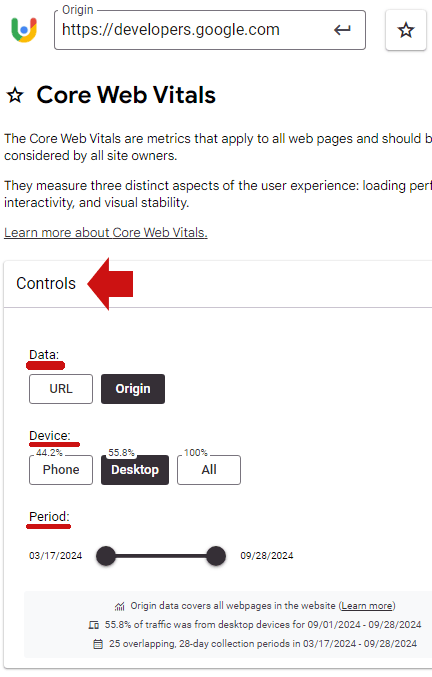
Users can adjust the variables displayed by using the Controls section, which allows filtering by data, device type, and time period.
Segmenting Data in CrUX Vis
CrUX Vis enables users to break down performance data into three key areas:
- Data: View performance by URL or across the entire site.
- Device: Segment the data by mobile, desktop, or both.
- Period: Visualize performance over the last six months, with time frames ranging from March 17, 2024, to September 28, 2024.
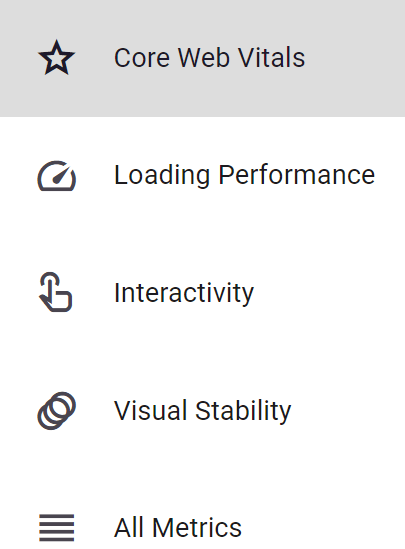
Analyzing Core Web Vitals and More
CrUX Vis offers five different ways to visualize data:
- Core Web Vitals
- Loading Performance
- Interactivity
- Visual Stability
- All Metrics Combined
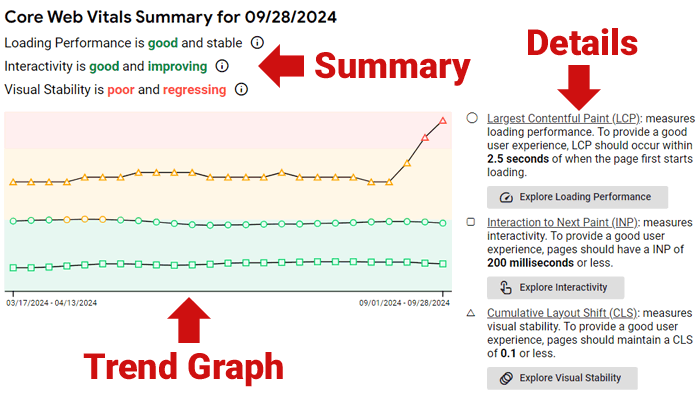
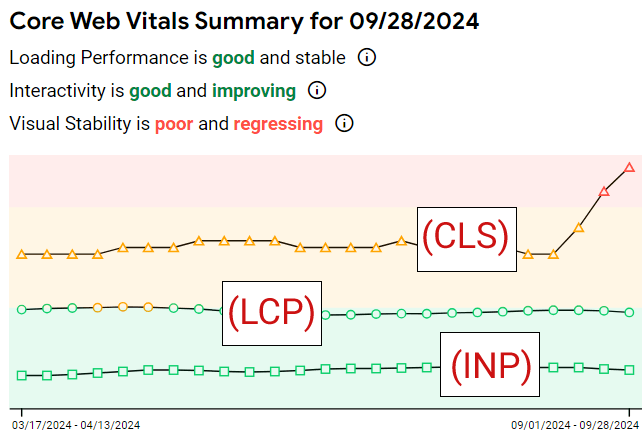
For Core Web Vitals, the tool presents a time-based trend graph using colors—green for good, yellow for caution, and pink for poor performance.
Each Core Web Vital is represented by a unique shape:
- Circle: Largest Contentful Paint (LCP)
- Square: Interaction to Next Paint (INP)
- Triangle: Cumulative Layout Shift (CLS)
The user interface on the desktop version includes a graph and a summary on the left side, with an explanation of each trend on the right.
Core Web Vital Trends
The tool highlights three types of trends:
- Good and Improving
- Good and Stable
- Poor and Regressing
This offers a quick snapshot of which Core Web Vitals are moving in the right direction and where improvements are needed.
Diving Deeper into Loading Performance
Navigating to the Loading Performance section provides additional insights into how quickly a site or URL loads. Users can explore metrics like:
- Largest Contentful Paint (LCP)
- First Contentful Paint (FCP)
- Time to First Byte (TTFB)
- Round Trip Time (RTT)
- Navigation Types
- Form Factors
Each metric can be toggled on or off to view the corresponding trend graph.
Who Can Benefit from CrUX Vis?
CrUX Vis is a valuable tool for publishers, digital marketers, and web developers who want to get a clear, data-driven picture of their website’s performance. It can also be helpful for competitor research and website audits, providing insights into areas of improvement.
Explore CrUX Vis Today
Ready to take your website performance to the next level? Check out CrUX Vis and see how your site performs based on real-world data.
FAQs
CrUX Vis (Chrome User Experience Visualization) is a new tool launched by Google to help users visualize Core Web Vitals trends. It allows site owners, developers, and marketers to analyze performance over time using real user data. The tool helps in identifying performance issues and optimizing user experiences.
Core Web Vitals are a set of metrics that measure user-centric aspects of web performance. These metrics include Largest Contentful Paint (LCP), Cumulative Layout Shift (CLS), and Interaction to Next Paint (INP), all of which reflect how users experience a website in terms of loading speed, interactivity, and visual stability.
The Chrome User Experience (CrUX) report is a public dataset that reflects how real Chrome users experience websites. It aggregates data on various performance metrics, including Core Web Vitals, from users around the world to help site owners understand the performance of their pages in real-world scenarios.
CrUX Vis allows website owners to visualize performance data across several variables like URL, device type, and time period. By analyzing trends over time, users can spot issues in Core Web Vitals and other performance metrics, making it easier to optimize their websites for a better user experience.
CrUX Vis uses data from the Chrome User Experience Report (CrUX), which collects metrics from real users browsing websites. It aggregates this data to provide insights on performance metrics like LCP, FCP, TTFB, and CLS.
The three Core Web Vitals are:
– Largest Contentful Paint (LCP): Measures loading performance.
– Interaction to Next Paint (INP): Measures interactivity.
– Cumulative Layout Shift (CLS): Measures visual stability.
Core Web Vitals are essential for delivering a good user experience. Optimizing these metrics helps improve page load times, reduce visual disruptions, and make pages more responsive. While they don’t directly affect search rankings, they do influence engagement, conversion rates, and overall user satisfaction.
CrUX Vis provides data visualization in several ways. Users can filter data by URL, device (mobile or desktop), and time period to view trends over the past six months. It also uses different shapes and colors to represent performance: circles for LCP, squares for INP, and triangles for CLS, with green, yellow, and pink indicating performance quality.
The CrUX score is derived from real-world performance data based on Core Web Vitals metrics. It provides a comprehensive view of how well a site performs for users in terms of speed, interactivity, and stability. A good CrUX score indicates an optimized, user-friendly experience.
Yes, CrUX Vis can help in competitor analysis by allowing users to compare their site’s performance against others. Since it uses publicly available CrUX data, it can provide insights into how competitor websites perform in terms of Core Web Vitals.
CrUX Vis is valuable for a range of users, including:
– Website Owners: To monitor and improve site performance.
– Developers: To debug and optimize web pages.
– Digital Marketers: To analyze user experience and optimize for better engagement and conversions.
– SEO Experts: To track performance metrics and optimize for page experience.
LCP is a Core Web Vital metric that measures how long it takes for the largest element on a page to become visible in the viewport. It’s a key factor in optimizing website loading speed, which can impact user engagement and SEO rankings.
INP measures how long it takes for a page to respond to a user’s input, such as clicking a button or interacting with a form. It reflects the interactivity of a website, and optimizing INP helps ensure smooth, responsive user experiences.
CLS measures the visual stability of a page by tracking how often elements shift unexpectedly while a page is loading. A low CLS score indicates a stable page where elements remain in place, improving the overall user experience.
CrUX Vis offers insights into loading performance metrics like LCP, FCP (First Contentful Paint), TTFB (Time to First Byte), and more. By visualizing these trends, users can identify bottlenecks in page load times and optimize their websites for faster performance.
CrUX Vis segments data in three main ways:
– Data by URL or entire site: Performance can be viewed for individual pages or the entire domain.
– Device type: Data can be filtered for mobile, desktop, or both.
– Time period: Users can view performance trends for the last six months or specific time frames.
CrUX Vis highlights three types of performance trends:
– Good and Improving: Core Web Vitals are performing well and improving over time.
– Good and Stable: Core Web Vitals are performing well and remain stable.
– Poor and Regressing: Core Web Vitals are performing poorly and deteriorating.
CrUX Vis uses a time-based trend graph with colors representing performance quality (green for good, yellow for caution, and pink for poor). Shapes are used to represent specific metrics: circles for LCP, squares for INP, and triangles for CLS.
CrUX stands for Chrome User Experience, a report that gathers data from real-world Chrome users to provide insights into website performance, focusing on user experience metrics like Core Web Vitals.
To pass Core Web Vitals, websites should aim to:
– Improve LCP: Ensure that the largest content loads within 2.5 seconds.
– Reduce CLS: Keep layout shifts below 0.1.
– Enhance INP: Ensure interactivity responds in under 100 milliseconds.